Plan Coverage
The Plan Coverage page gives you a school-wide view of how many enrolled students have been assigned an NCCD adjustment level, a disability category, and evidence records. It breaks these figures down by year group so you can quickly identify gaps in your data collection.
Use Plan Coverage when the question is not "which single student?" but "which year group, cohort or record type needs attention first?"
Accessing Plan Coverage
- Open the sidebar and expand the Plans section.
- Click Coverage.
Summary Cards
At the top of the page, four cards summarise your school's overall coverage:
- Total Enrolled: the number of students currently enrolled across all year groups.
- NCCD Coverage: how many students have been assigned an adjustment level, and how many have not. The percentage badge shows the proportion with an assigned level.
- Disability Category: how many students have a disability category classification, and how many are unclassified.
- Evidence: how many students have at least one evidence record. The percentage badge shows the proportion with evidence.
How to read the summary
The summary cards are not a pass or fail score. They are a triage tool.
If NCCD coverage is low, review student adjustment levels. If disability category coverage is low, check whether profiles need classification. If evidence coverage is low, use Audit Report and Evidence Log to find the records needing follow-up.
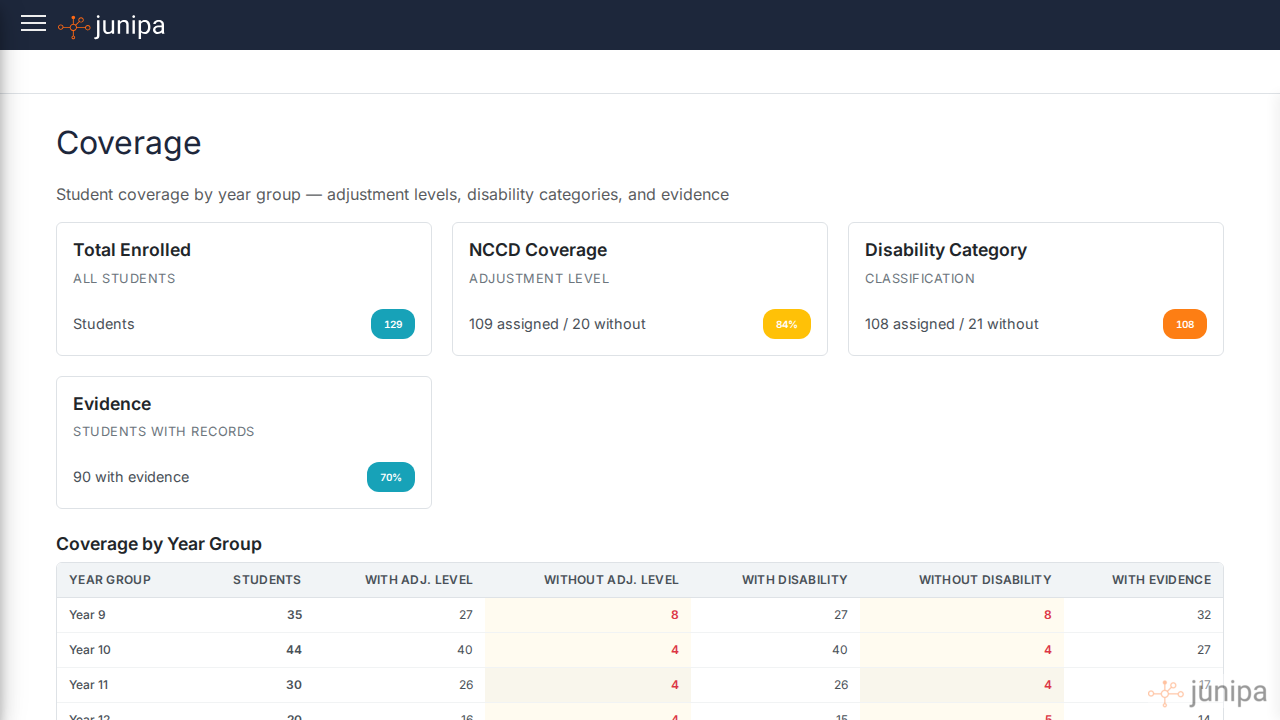
Coverage by Year Group
Below the summary cards, a table breaks down coverage by year group. Each row shows:
| Column | Description |
|---|---|
| Year Group | The student year level (e.g. Year 9, Year 10) |
| Students | Total enrolled students in that year group |
| With Adj. Level | Students who have an NCCD adjustment level assigned |
| Without Adj. Level | Students missing an adjustment level (highlighted in red if any) |
| With Disability | Students who have a disability category assigned |
| Without Disability | Students missing a disability category (highlighted in red if any) |
| With Evidence | Students who have at least one evidence record |
Red-highlighted cells indicate gaps that may need attention before the NCCD census period.
What leaders should do with gaps
Treat gaps as work planning, not blame.
Useful actions include:
- Ask a year-level leader to review students missing adjustment levels.
- Ask case managers to confirm disability categories.
- Ask teachers to add recent evidence for students with plans but no evidence.
- Open the Audit Report for a year group that looks light.
- Check Student Activity for students who have support work recorded but are not included.
Good weekly use
In the lead-up to census, use Plan Coverage once a week:
- Check the summary cards.
- Find the year group with the clearest gap.
- Decide whether the gap is about levels, categories or evidence.
- Assign follow-up to the staff member closest to the record.
- Re-check the same view after updates are made.
Coverage data reflects the current state of student records. Students who have been unenrolled or archived are not included in the counts.