Report builder data sources
The report builder lets you combine Junipa data with your own files in a single report. The Data Sources view is where you connect each report column to where its values come from, whether that is a column in an uploaded spreadsheet, a connected integration, or live Junipa data.
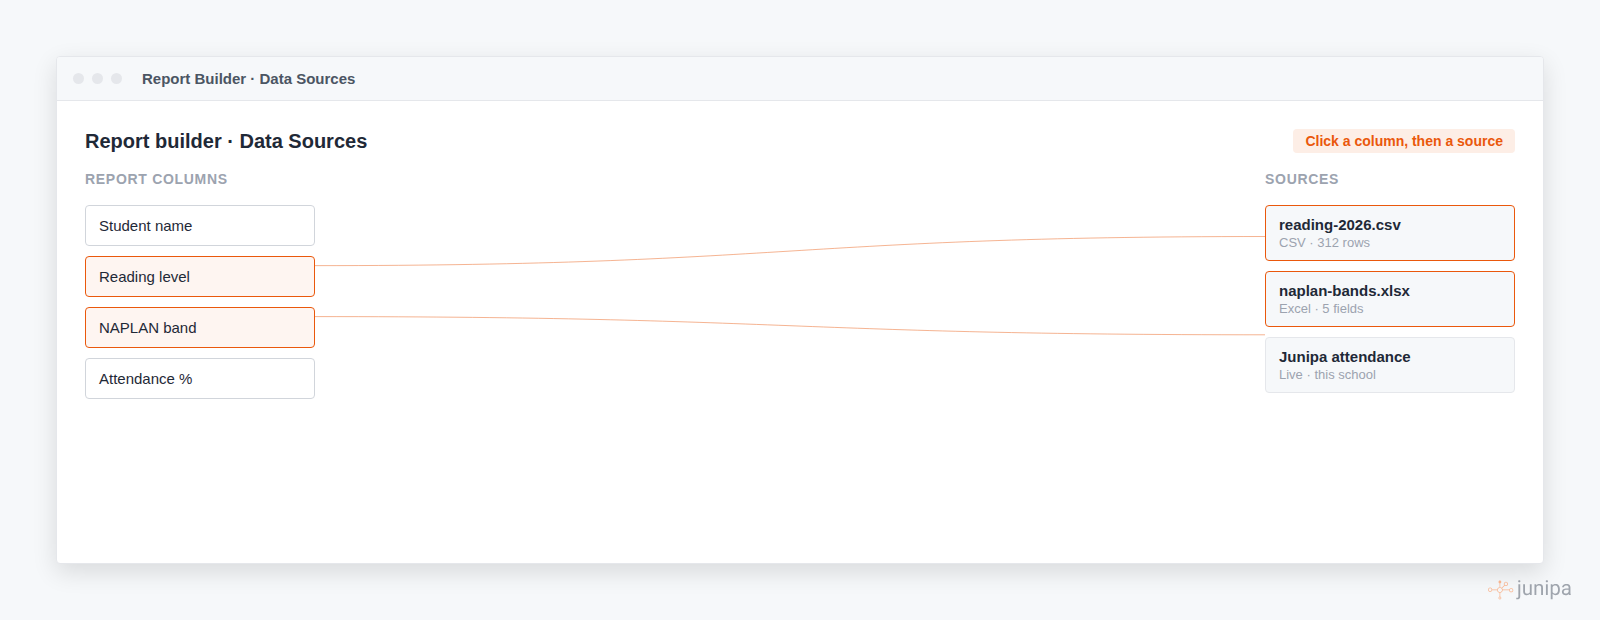
Connect a column to a source
Open a report in the builder and choose Data Sources. You will see your report columns on one side and your available sources on the other.
- Click a report column, then click a source to connect them. A cable is drawn between the two so the link is easy to follow.
- A column can draw from more than one source. Add the connections you need and each is kept against the column.
- To move a connection, click the existing link and point it at a different column or a different source. The cable and the values follow.
Add a source
Use Add source to bring in new data.
- Upload a CSV or Excel file. Junipa reads the columns so you can map them straight away.
- Connect through an integration where your school has one set up.
- Download an example format so the file you upload lines up cleanly with the report.
Sources already attached to the report stay available at the top of the list, so you can reuse a file across several columns.
Preview before you save
The builder shows a quick preview of the first rows as you work, using real data, so you can confirm a column is pulling the right values before you commit. When the report looks right, save it and it appears in the Reports list for the school.
Keep it tidy
Use the collapse and expand controls on the Sources heading to fold the panel down while you focus on the report layout, and open it again when you need to remap a column.