Adjustment Continuity Report
NCCD coordinators get asked one question directly: how is the school adjusting for a student who is partly off campus? The Adjustment Continuity Report answers it.
It reads from each student's Continuous Off-Site Adjustment schedule and shows, for the whole cohort, how many off-site days were scheduled, how many were confirmed, and where coverage is at risk.
Accessing the report
- Open the sidebar and expand the Reports section.
- Click Adjustment Continuity, or go directly to
/dashboard/reports/adjustment-continuity-report.
Use the Reporting year selector at the top to scope the report to the year you are reporting on.
Campus NCCD count
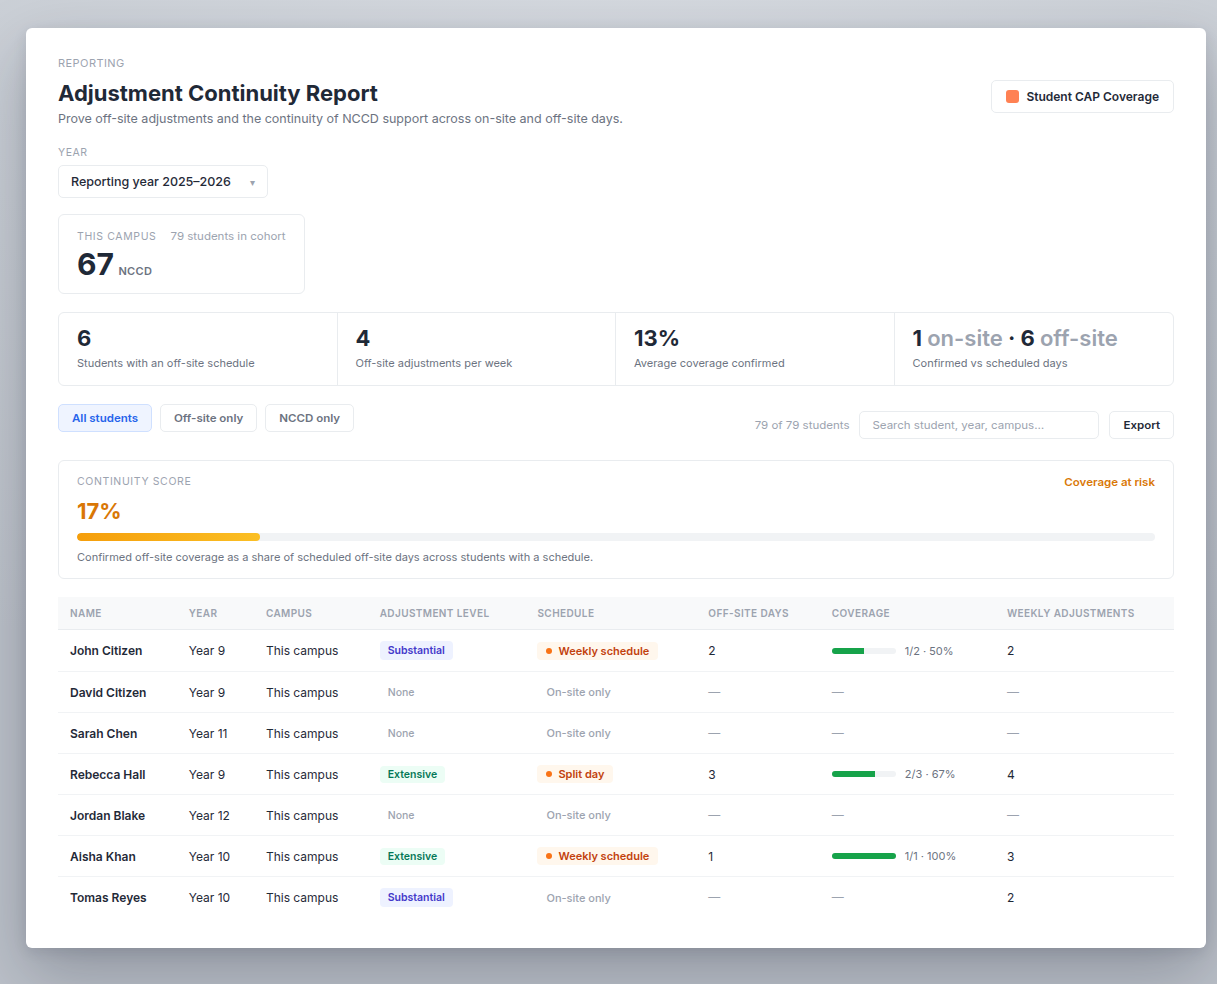
At the top, a campus card shows the NCCD count for the reporting year over the total cohort, for example 67 NCCD out of 79 students. A student counts as NCCD when they have an adjustment level beyond None. For multi-campus organisations the report splits these figures per campus.
The KPI strip
Four figures summarise off-site coverage across the cohort:
| KPI | What it means |
|---|---|
| Students with an off-site schedule | How many students in the cohort have a Continuous Off-Site Adjustment schedule. |
| Off-site adjustments per week | The total planned-adjustment coverage assignments across those students' off-site weeks. |
| Average coverage confirmed | The average, across scheduled students, of confirmed days as a share of their scheduled days. |
| Confirmed vs scheduled days | Confirmed off-site days (presence and support proven) against the total scheduled off-site days. |
Continuity score
The continuity score is a single number for the cohort: confirmed off-site days as a share of all scheduled off-site days, for students who have a schedule. It is the real, derivable signal of whether off-site coverage is actually being proven, not just planned.
A low score is flagged as Coverage at risk. It does not mean the support did not happen, it means the confirmations are not yet in. The fix is to chase the confirmations, not to re-plan.
Filtering the cohort
Four filters narrow the table:
- All students — everyone in the reporting year.
- Off-site — only students who have an off-site schedule.
- Extensive — only students at the Extensive adjustment level.
- NCCD — only students recorded under the NCCD.
A search box filters by student, year or campus, and Export downloads the current view as a CSV.
The per-student table
Each row is one student:
| Column | Description |
|---|---|
| Name | Links to the student's journal. |
| Year | The student's year level. |
| Campus | The campus the student belongs to (single-campus schools show one cohort campus). |
| Adjustment level | QDTP, Supplementary, Substantial, Extensive, or None. |
| Schedule | The schedule type: Weekly schedule, Alternating weeks, an N-week cycle, or Dynamic schedule. Students with no off-site schedule show as on-site only. |
| Off-site days | The number of scheduled off-site slots per cycle. |
| Coverage | Confirmed days over scheduled days, with the percentage. |
| Weekly adjustments | The number of planned adjustments delivered across the off-site week. |
How to read it for census
The report is a triage tool, not a pass or fail score.
- Check the continuity score. If it is flagged at risk, coverage is being planned but not confirmed.
- Filter to Off-site to see only the students with a schedule.
- Find the rows with low Coverage and chase the assigned staff member to confirm the days they delivered.
- Re-check the score after confirmations come in.
The report only counts what is confirmed. A scheduled day with no confirmation is treated as not yet proven, even if the support happened. Confirming days on the off-site schedule is what moves the numbers.
For the on-campus equivalent, where the question is continuous support across the whole school day rather than off-site coverage, see Continuous Adjustment Profile and Plan Coverage.